 This past week I was knocked out with probably the worst case of flu in my life. To put Flu Apocalypse 2012 into perspective- we’re talking no movement from bed, queasiness at the very sight of food and the inability to keep my eyes open for even the dapperest of heartthrobs plastered on the TV screen. It was awful.
Ever the workaholic, I wasn’t able to resist trying to find some way to make myself useful. I lugged my alternate hard drive next to me in bed and made a pact to finally sort through years of records I had digitally discarded for “safe keeping” into the virtual equivalent of a massive stack of papers in a dusty box in the back corner of a small room. Slowly I plodded through years of essays, PowerPoint research, homemade gifs, excel spreadsheets proving random theories, word documents of scatter-brained notes, and even the odd visio flow chart. While a lot of things struck me as interesting or inspiring or even down right touching- one piece really stood out.
There in probably the darkest of corners, in the most dusted up and cobwebbed digital box sat a PowerPoint presentation on what I saw the future of data to be. There are points of your life where you look back at past work and you internally exclaim, “Wow, maybe I am not dumb. I am actually pretty smart.” This was one of those times for me. Now, the PowerPoint and the explanations below aren’t perfect. Yes, with my new knowledge of the Internet some 5 years later, there are things that I would change. However, giving 5 years ago Anna the credit and justice she deserves ,I have decided to post the chart and supporting text unedited. It is surprising with all the time and all the changes in the digital industry that this PowerPoint still provides so much insight.

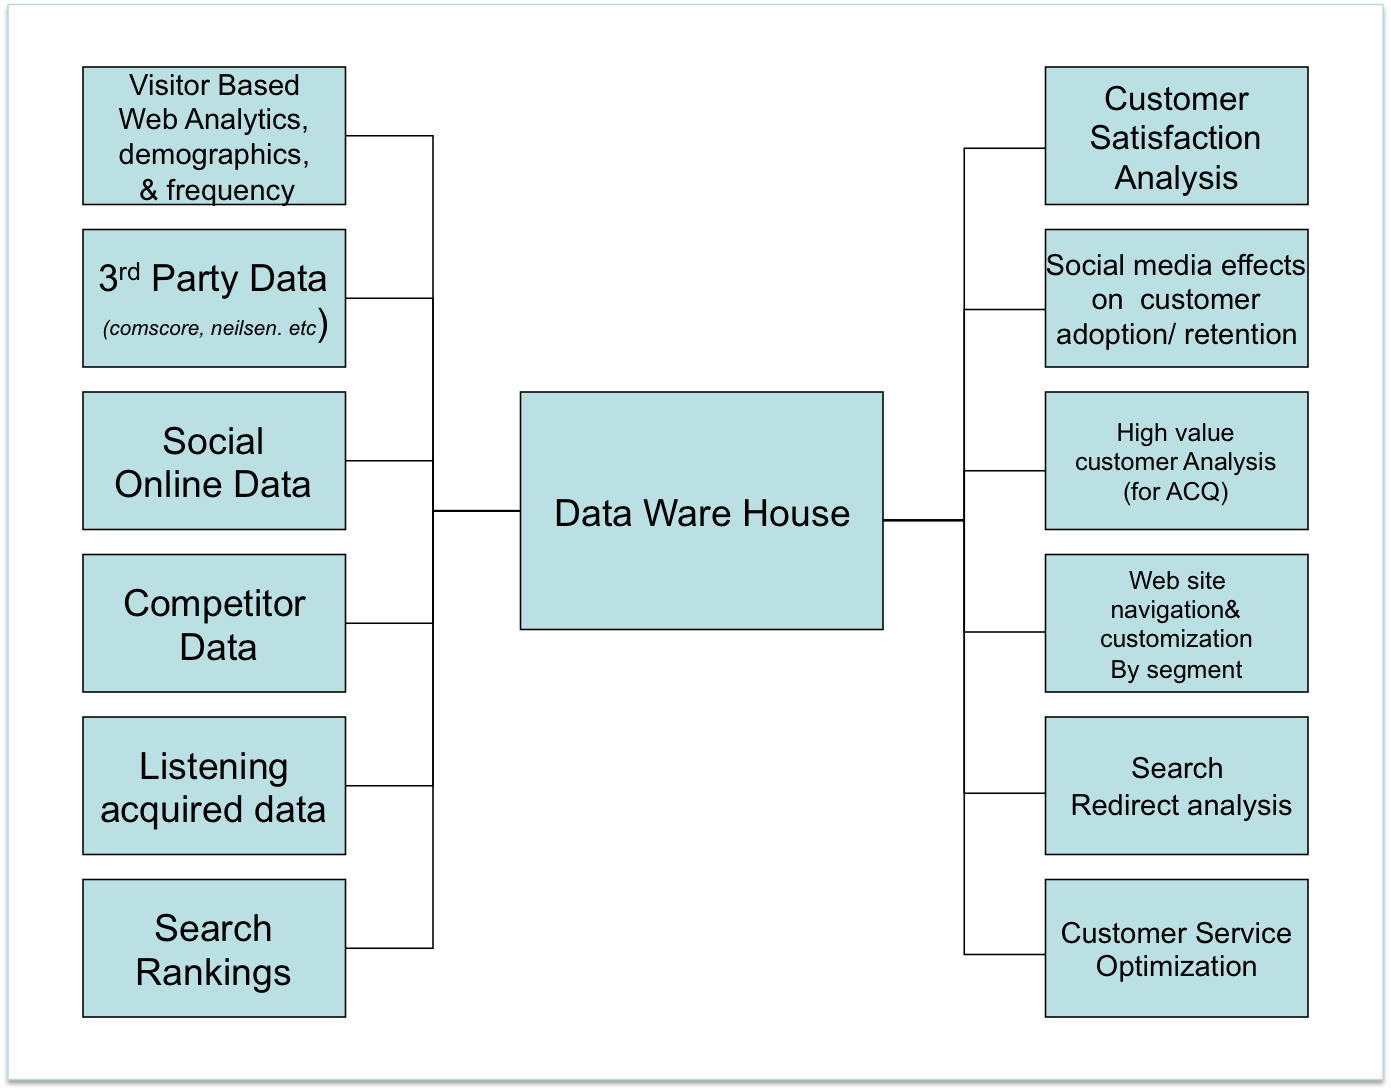
Overview of Data types
- Visitor Based Web Analytics, demographics, & frequency: Data aggregated at the visit level linked to a unique visitor id, which can be traced to account data. Audit data to ensure key customer interaction is being coded. IE email, phone, direct marketing between either party
- 3rd Party Data: Data evaluating client’s performance as well as key competitors’ and industry benchmarks. Ideally relying on several sources in order to make a more accurate aggregate source as an end result
- Social Online Data: Data evaluating Internet and competitor brand perception, hot industry topics, areas for adaptation and growth, and general social users information/background
- Competitor Data: Data evaluating competitor activity in market. Including financial, email & direct marketing cadence, in market events, web site, & interactive/ gorilla marketing.
- Listening acquired data: Data acquired by listening to the customer. Includes customer survey results, email, phone, and customer service interactions via any medium. Using an audio analysis software phone conversations are easily transferred to text. All text can then be analyzed for tone and emotion using similar software as social media online is analyzed
- Search Rankings: Analysis of key words in the industry, how often they are searched, and who owns the top three spots for each of the major engines.
Possible Analysis
Customer Satisfaction Analysis: What are the weak points in the customer communication train? Using not only the standard foresee surveys, we will use data coming from customer service, and social media analysis. Using this data to really listen to the consumer on a variety levels will allow us to better depict the strength of the brand among those who matter most- a brand’s customers
Social media effects on customer adoption/ retention: How is social media helping to retain, acquire, or lose customers? By charting brand perception across time and pairing it with a map of customer attrition and acquisition, a brand can identify what type of social communication is benefiting or hurting them. This could be especially useful in understanding the impact of a new campaign (something like the new social campaign they are doing on Facebook for cards).
High value customer Analysis (for ACQ): Matching backend customer information with front-end web data we can assess the Internet patterns of high value customers. We can then apply this data to incoming customers and create a unique way of identifying this type of customer. A high value customer could not only be based on the traditional financial information, but likeliness to convert, loyalty, cost to maintain relationship, and likeliness to embrace new technology. This would provide an accurate picture of the best “high value” online customer.
Web site navigation& customization by segment: Again using this pairing of back end and front end data, we can better understand those customers who are frequent users of the site. We can identify their most frequent use and help segment the site to customize it to their personal needs.
Search Redirect analysis: Going beyond the obvious multivariate testing of landing pages, using backend data (tagging applications with a mark indicating they came from search) we can find what banners and which sites actually attract the best customers not just the most.
Customer Service Optimization: See what is preventing user from getting the information they need. Using text analysis data of customer service communications we can better understand what customers are frustrated with or need help achieving. Uniting this knowledge with new site help tools can potentially reduce customer service spending by providing the right information, as it is needed.
 I love when brands take good charity ideas and give them a social twist. KitchenAid’s 1,000 Cooks for the cure is a great example of just that. The program encourages cooks of all kinds- from gourmet chef to home cookin’ heroes to use there talents to give back. Uniting a community around a good cause is always an excellent thing.


